
The Potential Advantages of a Contrarian Strategy
We believe the stock market has a way of consistently overvaluing prospects of highly regarded companies and just as consistently undervaluing those that appear to have lackluster outlooks. This pattern provides credence for Dreman Value Management's basic investment strategy of buying financially strong companies paying above-average dividends, but which are currently out of favor. The validity of Dreman Value Management's approach to investment management is confirmed by extensive studies. Over time, our studies indicate that in the great majority of cases, there has been a resurgence of earning power followed by renewed enthusiasm and higher market prices.
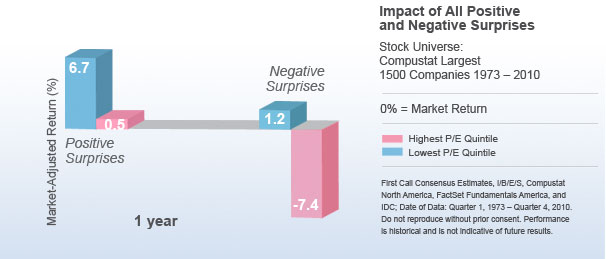
To understand the contrarian approach we must first examine analyst errors. Analysts and investors are too confident in their ability to forecast the future, which leads to over/under valuation of stocks and opens the doors to major market success for the contrarian. Analysts' estimates have been sharply and consistently off the mark. Based on information from First Call Consensus Estimates, I/B/E/S and A-N Research Corp., the average forecast error was a whopping 40% quarterly for the past 38 years. Dreman Value Management takes advantage of the high rate of analyst forecast error by positioning in out-of-favor, low P/E stocks in a diametrically opposite manner. Following a surprise quarter, low P/E stocks with positive surprises outperform the market by 6.7% in the following year. But positive surprises have a far less significant effect on favorite stocks-returning just 0.6% in the following year. Conversely, negative surprises are devastating to high P/E stocks (7.4% below market after one year), but go essentially unnoticed by low P/E stocks. The result is that out of favor, low P/E stocks outperform higher P/E stocks over time.
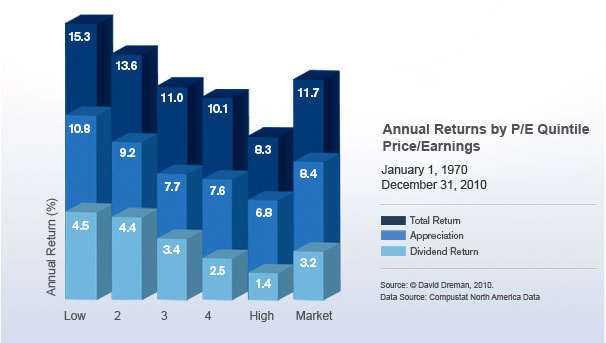
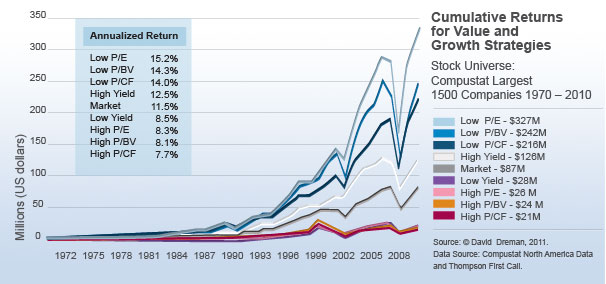
The validity of Dreman Value Management's approach to investment management is confirmed by a major study we undertook measuring the performance of the 500 largest companies in the nation between 1970 and 2010. (Please refer to the chart "Annual Returns by P/E Quintile.") Here is what we found. Including dividends, stocks with the lowest 20% of P/E multiples increased 15.3% annually, while stocks with the highest 20% of P/E multiples increased 8.3% annually, on average. The sample average, which closely tracks the S&P 500 Index, returned 11.7% annually during the same period. When one looks at the compounded returns, the difference is staggering. An investment of $1,000,000 in the lowest P/E group in 1970 and switched annually would have ended up at $327 million at the end of 2010, compared to $26 million for the highest P/E group.
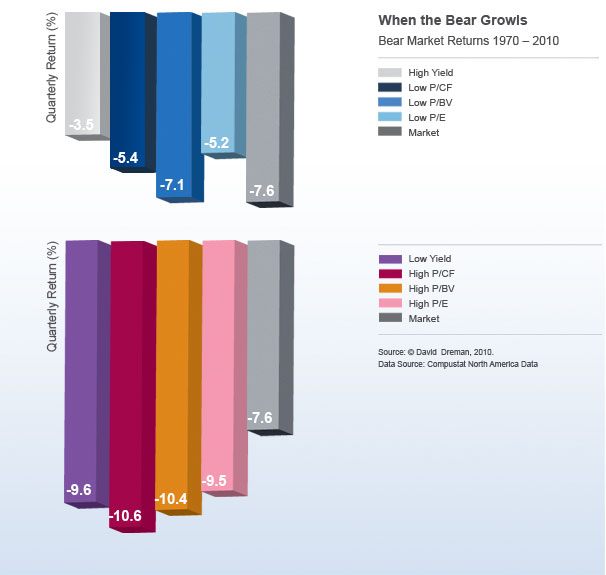
Significantly, this study also highlighted the stronger defensive characteristics of large dividend payers. As was briefly noted above, in years of poor markets, the combined appreciation and dividend components of return were always greater for the lower P/E group. They were able to "beat the market" in both bull and bear years. In 52 quarters when the S&P 500 declined during the 1970 - 2010 period, low P/E stocks outperformed the market by an average of 2.4% quarterly, while high P/E stocks underperformed by 1.9%.
Although, in our opinion, the low P/E method has an outstanding statistical record, it is rarely followed by investment advisors or by investment committees of large banks and insurance companies. Why? The rapidly developing field of behavioral finance answers this question. There are simply too many forces in the contemporary money management environment-peer pressures, client pressures, career pressures, psychological forces, and the like-which result in following the prevailing trends and fashions. This failure to adhere to proven and disciplined investment philosophies is, we believe, the principal reason for the lackluster record of so many management firms. The countless studies on low P/E investing suggest that the cost to their clients in terms of "investment opportunities foregone" has been enormous.
We have consistently advocated analyzing the returns of any investment strategy over time. For five decades, the low P/E strategy has demonstrably shown higher returns. True, in our analysis of individual years there were a few years in each decade when the strategy lagged, but the cumulative results over every decade were higher than the market. It takes both patience and discipline to adhere to a strategy. In periods when low P/E is not doing well, there is the all-too-human tendency to abandon it for a style that is performing better at the time. In the past this has usually proven to be a classic mistake-not unlike buying at the top or selling at the bottom.
Source: Dreman Value Management, LLC